Introduction to Data Science
1. What Is Data Science?
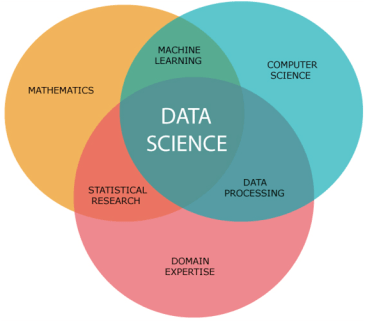
Data Science is a multidisciplinary field that combines statistics, mathematics, programming, and domain knowledge to collect, process, analyze, and interpret data.
The main goal is to turn raw data into useful information and insights that can support better decisions.
A simple way to think about it is:
Data → Information → Insight → Decision
For example, a football club may collect data about players' goals, assists, passes, distance covered, shots, and fitness. A data scientist can analyze this information to discover patterns and help the club understand player performance.
2. Why Is Data Science Important?
Modern organizations generate huge amounts of data from websites, mobile applications, sensors, transactions, social media, databases, and other systems.
Data Science helps organizations answer questions such as:
- What is happening?
- Why is it happening?
- What patterns exist in the data?
- What might happen in the future?
- What action should we consider?
Data Science is used in many areas, including:
- Business and finance
- Healthcare
- Education
- Sports
- Marketing
- Cybersecurity
- Transportation
- Manufacturing
- Scientific research
- Artificial Intelligence
3. Data Science vs. Data Analysis
Data analysis focuses mainly on examining data to understand what it tells us.
Data Science is broader. It can include:
- Data collection
- Data cleaning
- Exploratory data analysis
- Statistical analysis
- Data visualization
- Machine learning
- Predictive modeling
- Communication of results
- Deployment and monitoring
Therefore, data analysis is an important part of Data Science, but the two terms are not always identical.
4. The Data Science Lifecycle
A typical Data Science project follows an iterative process. Different organizations use different lifecycle models, but common stages include:
- Define the problem
- Collect data
- Clean and prepare data
- Explore the data
- Analyze and model
- Evaluate results
- Communicate or deploy the solution
- Monitor and improve
Step 1: Define the Problem
Before writing code, understand the question that needs to be answered.
For example:
"Can we predict whether a football player will score a goal based on previous match statistics?"
A clear problem makes it easier to decide what data is required and what type of analysis should be performed.
Step 2: Collect Data
Data can come from many sources:
- Databases
- APIs
- CSV files
- Websites
- Surveys
- Sensors
- Business systems
- Public datasets
The quality and relevance of the data are important.
Step 3: Clean and Prepare Data
Real-world data is often messy.
It may contain:
- Missing values
- Duplicate records
- Incorrect values
- Different formats
- Outliers
- Inconsistent names
Data cleaning prepares the dataset for reliable analysis.
Example:
import pandas as pd

df = pd.read_csv("players.csv")

print(df.head())
print(df.isnull().sum())

df = df.drop_duplicates()
Step 4: Explore the Data
Exploratory Data Analysis (EDA) is used to understand the dataset.
A data scientist may examine:
- Minimum and maximum values
- Averages
- Distributions
- Relationships between variables
- Outliers
- Trends
- Correlations
Example:
print(df.describe())
print(df.corr(numeric_only=True))
Visualization is also important.
import matplotlib.pyplot as plt

df["goals"].hist()
plt.xlabel("Goals")
plt.ylabel("Number of Players")
plt.show()
Step 5: Analyze and Build Models
After understanding the data, statistical methods or machine learning models can be used.
Examples include:
- Linear regression
- Logistic regression
- Decision trees
- Random forests
- Clustering
- Neural networks
Machine learning is useful when we want a computer system to learn patterns from data and make predictions or classifications.
Step 6: Evaluate the Results
A model should not simply be accepted because it produces an output.
We need to evaluate how well it performs.
Common metrics include:
- Accuracy
- Precision
- Recall
- F1-score
- Mean Absolute Error (MAE)
- Root Mean Squared Error (RMSE)
- R²
The correct metric depends on the problem.
Step 7: Communicate or Deploy
The results need to be understandable to other people.
Possible outputs include:
- Reports
- Charts
- Dashboards
- Presentations
- Web applications
- APIs
- Machine learning services
A technically correct analysis is not very useful if nobody can understand or use the result.
Step 8: Monitor and Improve
Data Science projects do not always end after a model is deployed.
New data can change patterns. Models may need to be monitored, retrained, or improved.
5. Important Skills for Data Science
Programming
Python is one of the most widely used programming languages for Data Science.
Important Python libraries include:
- NumPy — numerical computing
- Pandas — data manipulation and analysis
- Matplotlib — data visualization
- Seaborn — statistical visualization
- Scikit-learn — machine learning
R is another important language, especially for statistics and data analysis.
Statistics
Statistics helps us understand uncertainty, variation, relationships, and patterns.
Important topics include:
- Mean
- Median
- Mode
- Variance
- Standard deviation
- Probability
- Distributions
- Correlation
- Hypothesis testing
- Confidence intervals
Mathematics
Depending on the Data Science role, useful mathematics includes:
- Algebra
- Probability
- Statistics
- Linear algebra
- Calculus
- Optimization
SQL and Databases
Data is frequently stored in databases.
SQL is used to retrieve and manipulate data.
Example:
SELECT player_name, goals
FROM players
WHERE goals > 10
ORDER BY goals DESC;
Data Visualization
Visualization helps people understand complex datasets.
Common chart types include:
- Bar charts
- Line charts
- Histograms
- Scatter plots
- Box plots
- Heatmaps
6. Data Science, Machine Learning, and AI
These terms are related but are not exactly the same.
Artificial Intelligence (AI)
AI is a broad field focused on creating systems that perform tasks associated with intelligent behavior.
Machine Learning (ML)
Machine Learning is a branch of AI where algorithms learn patterns from data.
Data Science
Data Science is a broader problem-solving discipline that combines data, statistics, computing, analysis, communication, and sometimes machine learning.
A Data Scientist may use machine learning, but not every Data Science problem requires machine learning.
7. Example: Football Data Science
Imagine a dataset containing:
| Player | Goals | Assists | Pass Accuracy | Distance (km) | |---|---:|---:|---:|---:| | Player A | 12 | 8 | 86% | 105 | | Player B | 7 | 11 | 91% | 112 | | Player C | 15 | 5 | 82% | 98 |
A football data scientist could investigate questions such as:
- Which players create the most attacking opportunities?
- Does pass accuracy relate to assists?
- Which players cover the most distance?
- Can we predict goals?
- How does performance change between matches?
- Which player characteristics are associated with winning?
This demonstrates how Data Science can be applied to a real-world domain.
8. A Simple Data Science Project
A beginner project could follow this workflow:
Choose a question
      ↓
Find a dataset
      ↓
Load the data
      ↓
Clean the data
      ↓
Explore the data
      ↓
Visualize patterns
      ↓
Build a model (if needed)
      ↓
Evaluate the result
      ↓
Explain the findings
For example, you could download a football dataset and analyze:
"What factors are associated with a player's number of goals?"
You could use Python, Pandas, Matplotlib, and Scikit-learn.
9. Beginner Data Science Roadmap
A practical learning order is:
Stage 1 — Python
Learn:
- Variables
- Data types
- Conditions
- Loops
- Functions
- Lists and dictionaries
- File handling
- Object-oriented programming basics
Stage 2 — NumPy and Pandas
Learn how to:
- Load datasets
- Filter rows
- Select columns
- Handle missing values
- Group data
- Sort data
- Calculate statistics
Stage 3 — Data Visualization
Learn:
- Matplotlib
- Seaborn
- Basic chart selection
- Reading and explaining charts
Stage 4 — Statistics
Learn:
- Descriptive statistics
- Probability
- Distributions
- Correlation
- Hypothesis testing
Stage 5 — SQL
Learn:
- SELECT
- WHERE
- ORDER BY
- GROUP BY
- JOIN
- Subqueries
- Aggregations
Stage 6 — Machine Learning
Start with:
- Linear regression
- Logistic regression
- Decision trees
- Random forests
- K-nearest neighbors
- Clustering
- Model evaluation
Stage 7 — Projects
Build real projects using real datasets.
Examples:
- Football performance analysis
- F1 race analysis
- House price prediction
- Customer churn prediction
- Sales analysis
- Weather analysis
10. Common Mistakes Beginners Make
Mistake 1: Starting with Deep Learning Immediately
Deep learning is powerful, but beginners should first understand Python, statistics, data cleaning, and basic machine learning.
Mistake 2: Focusing Only on Coding
Data Science is not only programming.
Understanding the problem and interpreting the results are equally important.
Mistake 3: Ignoring Data Cleaning
A sophisticated model cannot automatically fix poor-quality data.
Mistake 4: Confusing Correlation with Causation
If two variables are correlated, that does not automatically mean one causes the other.
Mistake 5: Building Projects Without Explaining Them
A good project should explain:
- The problem
- The dataset
- The cleaning process
- The analysis
- The model, if used
- The results
- The limitations
- The conclusion
11. Useful Tools
| Tool | Main Purpose | |---|---| | Python | Programming | | NumPy | Numerical computing | | Pandas | Data manipulation | | Matplotlib | Visualization | | Seaborn | Statistical visualization | | Scikit-learn | Machine learning | | Jupyter Notebook | Interactive analysis | | Google Colab | Cloud-based Python notebooks | | SQL | Database querying | | Excel | Basic data analysis |
12. Conclusion
Data Science is the process of using data, statistics, computing, and domain knowledge to answer questions and generate useful insights.
A beginner should not focus only on machine learning or artificial intelligence. A strong foundation should include:
Python → Pandas/NumPy → Data Visualization → Statistics → SQL → Machine Learning → Real Projects
The most important skill is learning how to turn a real-world question into a data problem, analyze the available evidence, and communicate the result clearly.
References
-
OpenStax, Introduction to Python Programming — Introduction to Data Science: https://openstax.org/books/introduction-python-programming/pages/15-1-introduction-to-data-science
-
OpenStax, Principles of Data Science — What Is Data Science?: https://openstax.org/books/principles-data-science/pages/1-1-what-is-data-science
-
Learning Data Science, The Data Science Lifecycle: https://learningds.org/ch/01/lifecycle_intro.html
-
R. Ressler, An Introduction to Data Science and Artificial Intelligence: https://rressler.quarto.pub/intro-ds-ai/01_ds_getting_data_main.html